Just a few weeks ago, 11.3 million Nepali citizens exercised their right to vote for the government they hope will deliver economic prosperity. But the same economic aspiration has, over decades, quietly driven a large number of people away from their places of birth—within Nepal and beyond its borders. For many of those who moved, that election may not have been theirs to participate in.
Data from the 2021 Nepal Census show that 40 per cent of Nepal's population resides outside their municipality of birth but within the country, and an additional 7 per cent live abroad. The share of those living outside their district of birth has grown fourfold over the past six decades—from 5 per cent in 1961 to 20 per cent in 2021. Nepal is, in short, a country on the move.
Nepal's electoral laws have not kept pace with this mobility. A citizen can only vote where they are registered as a permanent resident. Transferring registration requires a migration certificate from the ward office and an in-person visit to a District Election Office, a multi-step process that poses significant bureaucratic hurdles in practice, and one that few domestic migrants navigate successfully. The government's decision to declare a three-day public holiday before the March 2026 election to allow voters to travel back home is an implicit acknowledgement of just how many people no longer live where they are registered. Voting with their feet, it turns out, can come at the cost of voting in elections.
Figure 1a: Net difference between registered voters and residents, by municipality

Figure 1b: Net difference between registered voters and residents, by municipality

By comparing the spatial distribution of the 25–60 age group in the 2021 Census against the same cohort in the 2026 voter rolls, we estimate that at least 1 million voters are spatially disenfranchised—roughly 9 per cent of registered voters aged 30–65 (Figure 1). This estimate covers only domestic migrants. Every metropolitan and sub-metropolitan city in Nepal has a net surplus of spatially disenfranchised voters, while 92 per cent of rural municipalities (gaunpalikas) and 73 per cent of urban municipalities (palikas) have a net deficit—more registered voters than actual residents of voting age. The true figure is almost certainly higher—aggregating net surpluses at the municipality level masks the gross displacement of voters across constituencies.
Figure 2: Net migration rates and migrant population shares, by municipality type

This pattern maps closely onto Nepal's internal migration flows. Metropolitan and sub-metropolitan cities—which have seen the highest net in-migration rates over the past decades and where the largest share of current residents were born elsewhere—consistently show a surplus of spatially disenfranchised voters (Figure 2). Gaunpalikas and palikas, which have experienced net outflows, show the reverse. The data suggest that spatial voter displacement is not random: it follows migration. The correlation between a municipality's net migration rate and its share of spatially disenfranchised voters is strongly positive, with a correlation coefficient of 0.764 (Figure 3). People move for economic opportunity but remain registered—and therefore must vote—where they came from.
Figure 3: Correlation between net migration and resident-voter mismatch across municipalities

No city illustrates this more starkly than the Kathmandu Metropolitan City (KMC). As the historic destination of migrants from across Nepal—drawn by economic opportunity or displaced by conflict—KMC has the largest absolute number of spatially disenfranchised voters of any municipality (0.23 million), with more spatially disenfranchised voters than there are registered voters in the city itself.
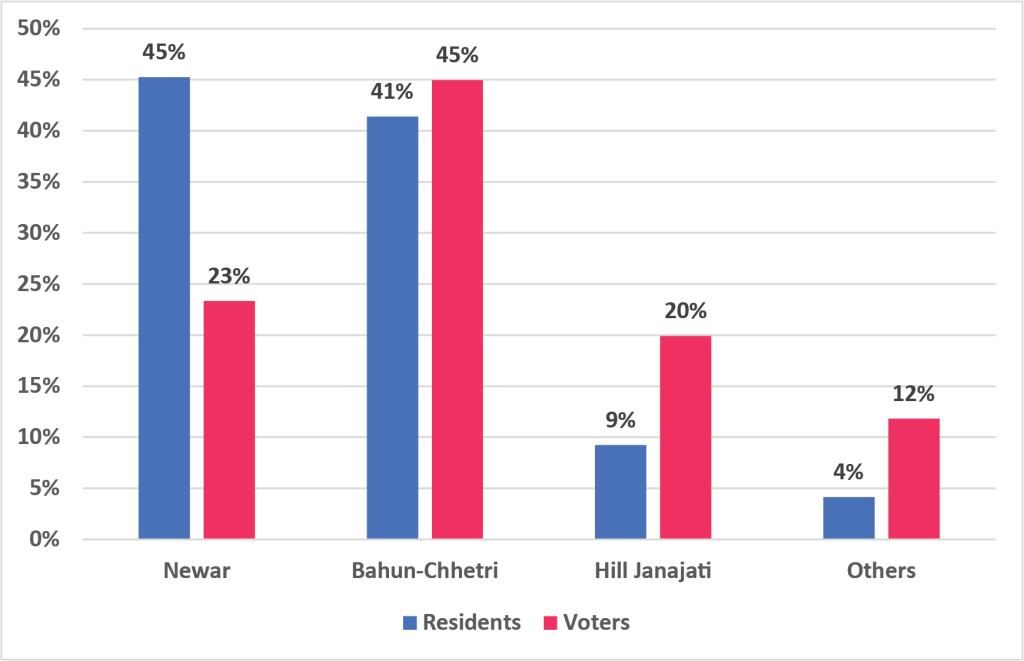
The KMC voter roll diverges from the census in several key dimensions, reflecting who has settled in the city recently versus who has been registered there longest. The electorate skews slightly female and significantly older—46 per cent of residents fall in the 45–65 age band, compared to 59 per cent of the electorate (Figure 4). Ethnically, Newars—the indigenous inhabitants of the Kathmandu Valley—are overrepresented relative to their census share (23 per cent of residents versus 45 per cent of the electorate). Non-Newar Hill Janajati groups, who are largely recent migrants into the valley, are severely underrepresented (20 per cent of residents versus 9 per cent of the electorate).
Figure 4a: Divergence in age and ethnic composition between KMC residents and voters
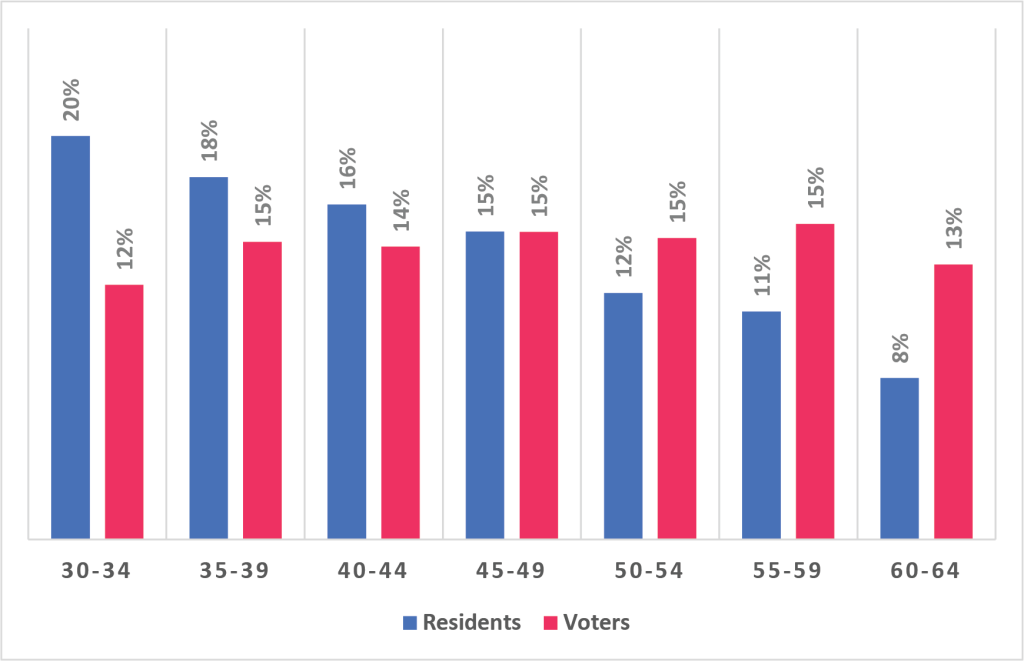
Figure 4b: Divergence in age and ethnic composition between KMC residents and voters
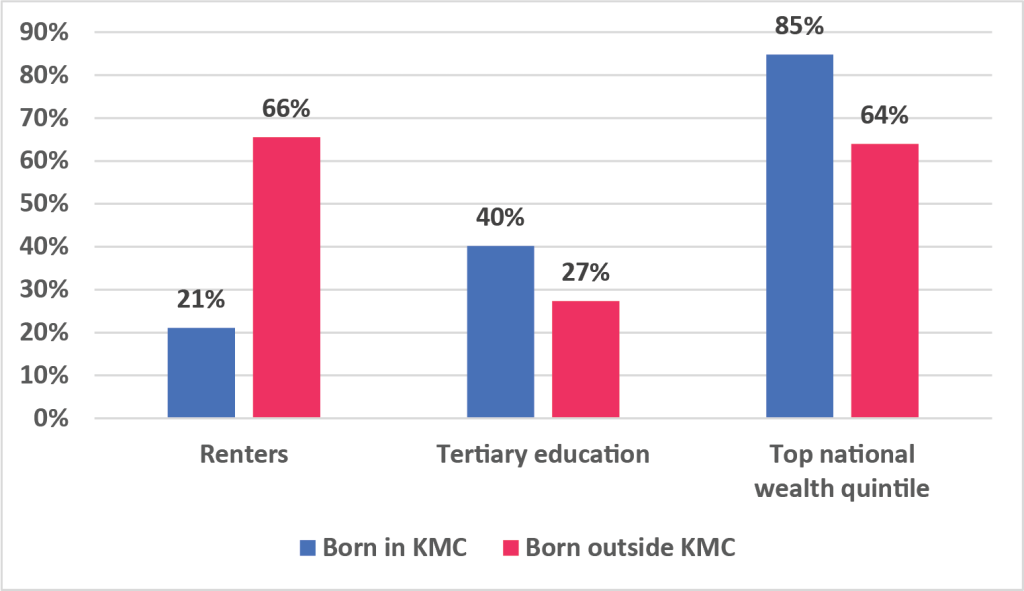
These demographic differences point to a potentially significant divergence in policy preferences. Census data show that KMC residents born outside KMC (Figure 5)—a proxy for the spatially disenfranchised—are significantly more likely to be renters (66 per cent versus 21 per cent), less likely to have completed tertiary education (27 per cent versus 40 per cent), and less likely to be in the top national wealth quintile (64 per cent versus 85 per cent). The spatially disenfranchised—more economically precarious and more likely to be renters—remain largely invisible to the electoral process that governs their daily lives.
Figure 5: Socioeconomic differences between KMC natives and migrants
This pattern extends within the city: wards where the largest share of residents were born outside the district—and where spatially disenfranchised voters are most concentrated—also have fewer public services. Ward-level data show a negative correlation between the share of outside-district-born residents and both education establishments per capita and health establishments per capita (Figure 6). The wards most underrepresented in the electorate are, in other words, those with the least access to public services.
Figure 6a: Public service provision and migrant concentration across KMC wards

Figure 6b: Public service provision and migrant concentration across KMC wards

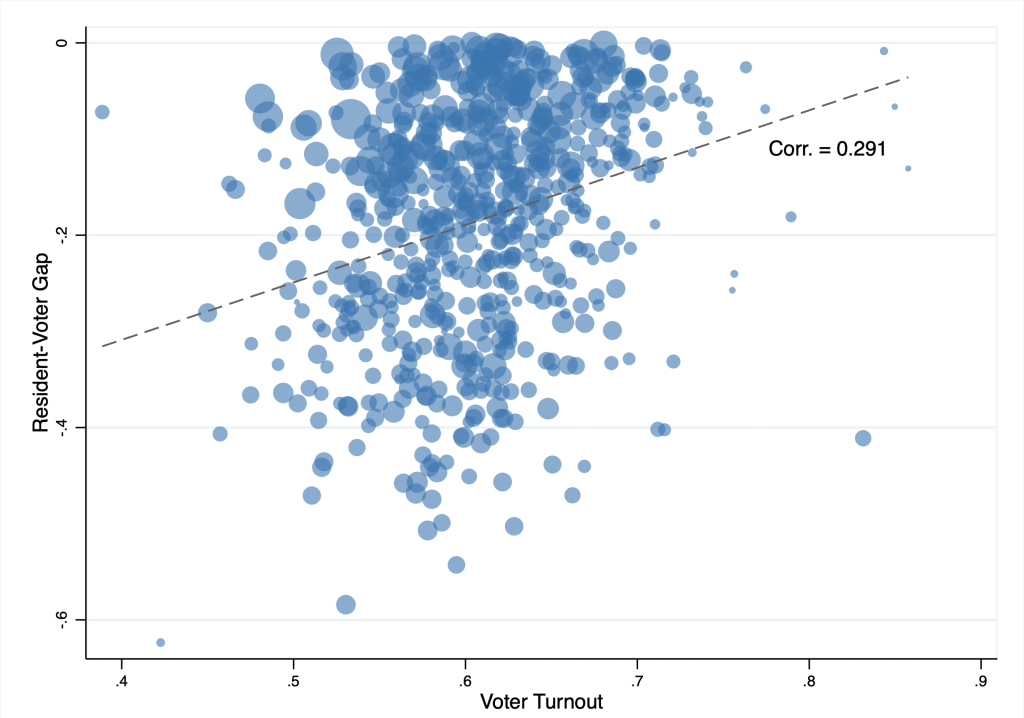
The electoral consequences are measurable at the national level too: among municipalities with a net deficit of registered voters relative to residents, the larger the deficit, the lower the voter turnout in the 2022 local elections (Figure 7).
Figure 7: Correlation between voter turnout and voter deficit across net deficit municipalities
Spatial disenfranchisement is not a minor administrative inconvenience—it is a structural distortion in who gets represented and whose needs shape policy. This distortion is particularly consequential for Nepal's next local elections in spring 2027: decentralisation was designed precisely to strengthen the link between residents and their representatives, yet spatial disenfranchisement undermines that promise for a large and growing share of urban residents. The 2026 election was widely read as a signal of a younger, urbanising Nepal asserting itself at the ballot box. Yet, in Nepal's cities, the electorate skews older and more established than the population it nominally represents; young migrants, though present in growing numbers, can be largely absent from the urban electorate.
As Nepal urbanises and internal migration accelerates, the gap between where people live and where they vote will only widen. Closing it will require more than a three-day holiday. It will require residency-based voter registration that keeps pace with how Nepalis actually live, so that voting with your feet and voting in elections are no longer a choice between one or the other.
