
In all populations, ageing is an inevitable result of age structure transitions as societies move from high mortality and high fertility, yielding an initial high growth of the population to eventually low mortality and low fertility, leading to a decrease in population. Population ageing and its social and economic implications have received significant attention in the documents of international organisations, the academia, and in the media in recent years.
According to the State of World Population Report 2025, 10 per cent of the world’s population is aged 65 years and above. That proportion is 21 per cent in more developed regions and 8 per cent in the less-developed ones. Among South Asian countries, India, Nepal, Bangladesh, and Bhutan are listed as having 7 per cent of their population in that age group, Maldives, 5 per cent, Pakistan 4 per cent and Sri Lanka, 12 per cent. Afghanistan has the smallest proportion of its population in that age category, only 2 per cent.
This essay looks at the 2021 census as it relates to the population of the aged in Nepal and compares it with data going back half a century and more to shed light on a subject that has generally been overlooked in both academic literature and popular discourse. It should be noted here that Nepal’s Senior Citizen’s Act 2063 (2006) defines individuals aged 60 years and above as senior citizens. The discussion below is based on that definition even though the specified age bracket for considering someone a senior citizen is primarily a matter of convenience.
Increasing Population Size
In 2021, the total population of senior citizens in Nepal was 2,977,318—i.e., 10.2 per cent of the total population. In other words, one out of every 10 persons in Nepal was a senior citizen. Over the decade of 2011–2021, the population of senior citizens had increased by 38.2 per cent, with the addition of 822,908 people, whereas the corresponding increase in the country’s total population was only 10.1 per cent. More importantly, the rise in the number of people within this age bracket of senior citizens was equal to 30.8 per cent of the total population increase between 2011 and 2021 (Table 1).
Table 1: Aged Population and Its Changing Size, 1952/54-2021
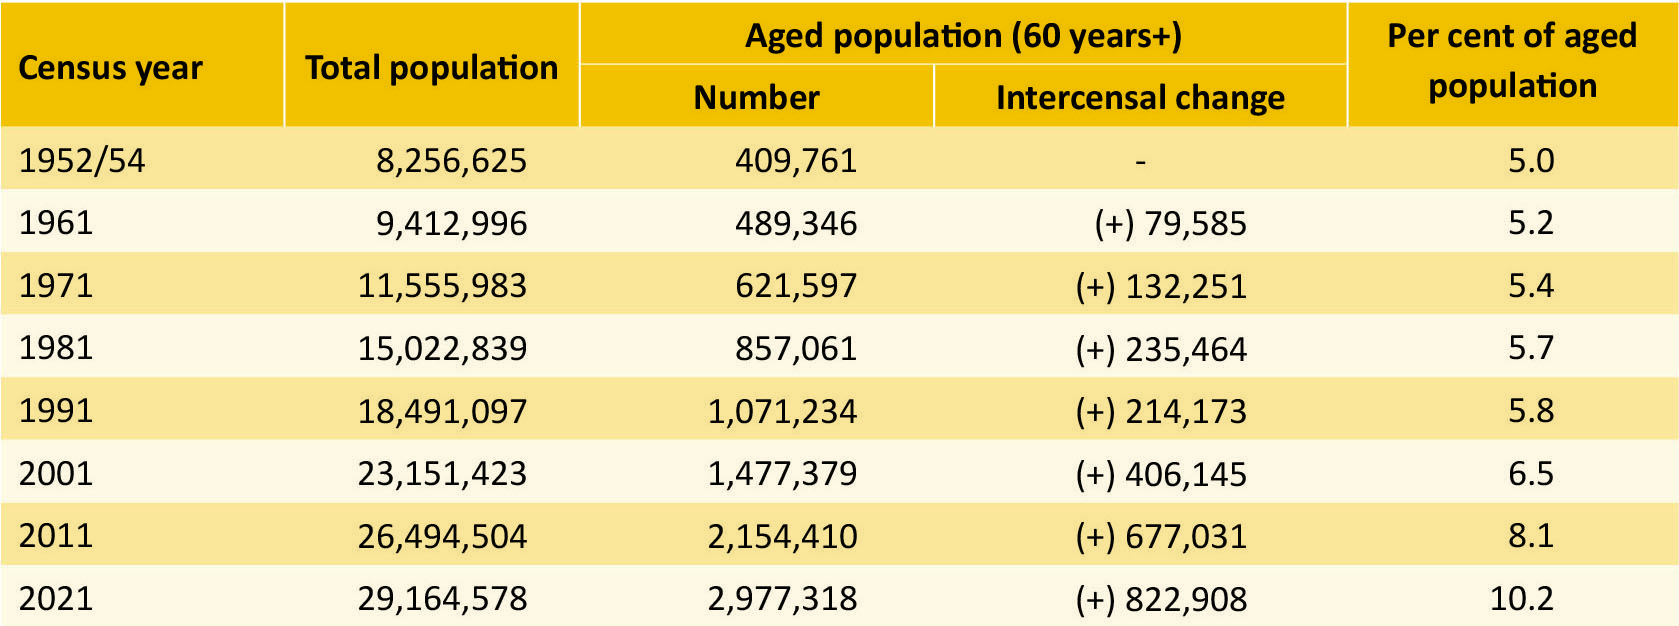
This elderly population has continued to increase over the decades and its increase far exceeds the proportional increase in the total population. Over the past 70 years, the numerical increase of the ageing population was 7.3-fold whereas the corresponding increase in the total population of the country was only 3.5 time more. The proportional share of the elderly in the total population of the country increased from 5 per cent in 1952/54 to 10.2 per cent in 2021. The overall improvement of health services over these decades has had much to do with the increase of elderly population both numerically and proportionally.
Distribution by Sex
Females outnumbered males among the aged population in 2021. Of the total, women constituted 51.5 per cent and men 48.5 per cent. This proportional share closely mirrored the national population distribution of 51.1 per cent females and 48.9 per cent males. In addition, it also highlighted a slightly higher presence of females among the elderly compared to the overall population. With the exception of the censuses of 1981 and 1991 the share of the female elderly has consistently remained higher in all the censuses, with the highest being in 2001 when women made up 56.4 per cent of that population (Table 2).
Table 2: Distribution and Change in Aged Population by Sex, 1952/54–2021
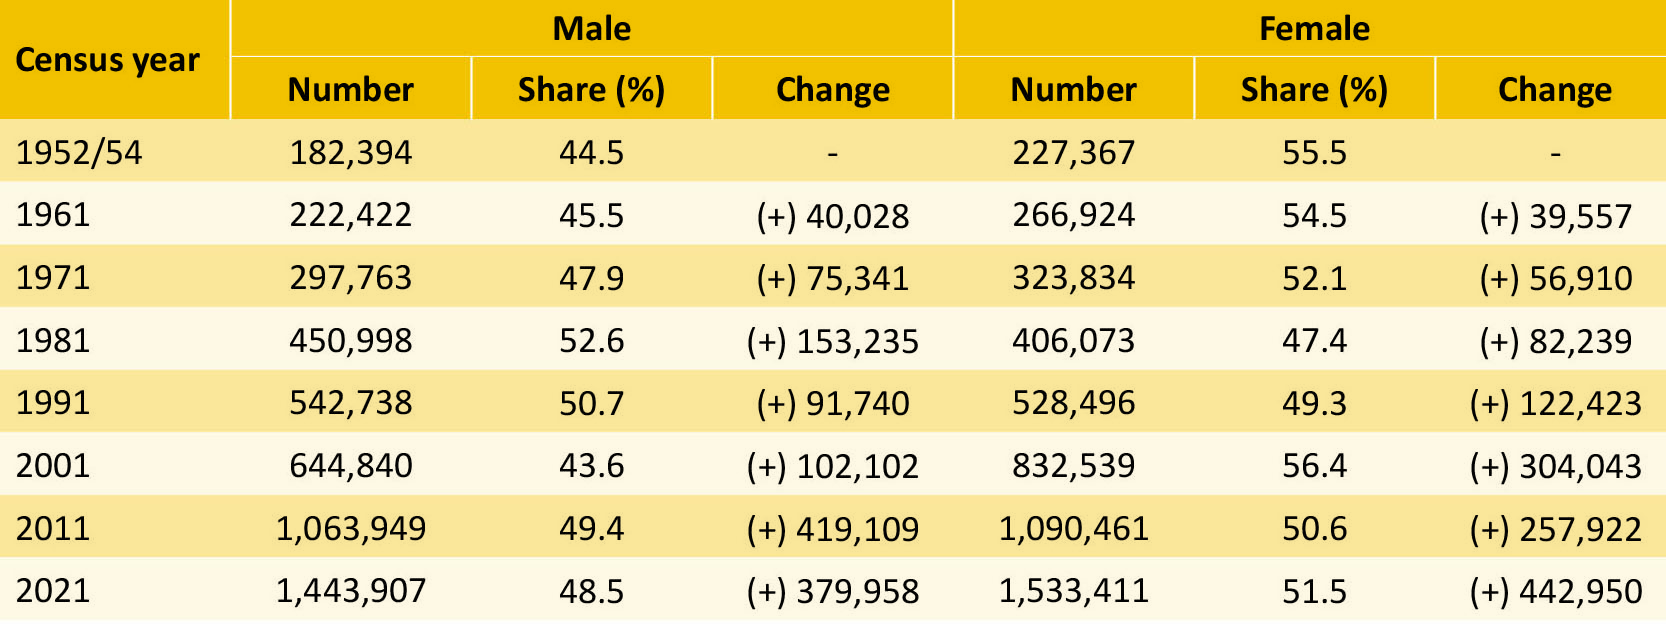
Over the past seven decades, the population of aged males increased by nearly eight times while the corresponding figure for females was around seven-fold, a seeming discrepancy resulting largely from the higher base population of females in 1952/54. The total population size of elderly females was consistently higher than that of males in the last three census results, with an average increase of elderly males by 300,390 and of females by 334,972 persons in each intercensal decade.
Growth Rate of Older People
With the exception of 1981 and 1991, the intercensal growth rates of the older population remained consistently over 3 per cent per annum in all the other censuses. If this rate continues, the population of older people in Nepal is likely to double in less than 25 years. In spite of the slight annual decline from 3.77 to 3.08 per cent between 2011 and 2021, the overall proportion of the elderly will continue to increase. This should be of serious concern to planners and policymakers as it would affect the entire architecture of the country’s social and economic policies, particularly gerontological health care and social security provisions.
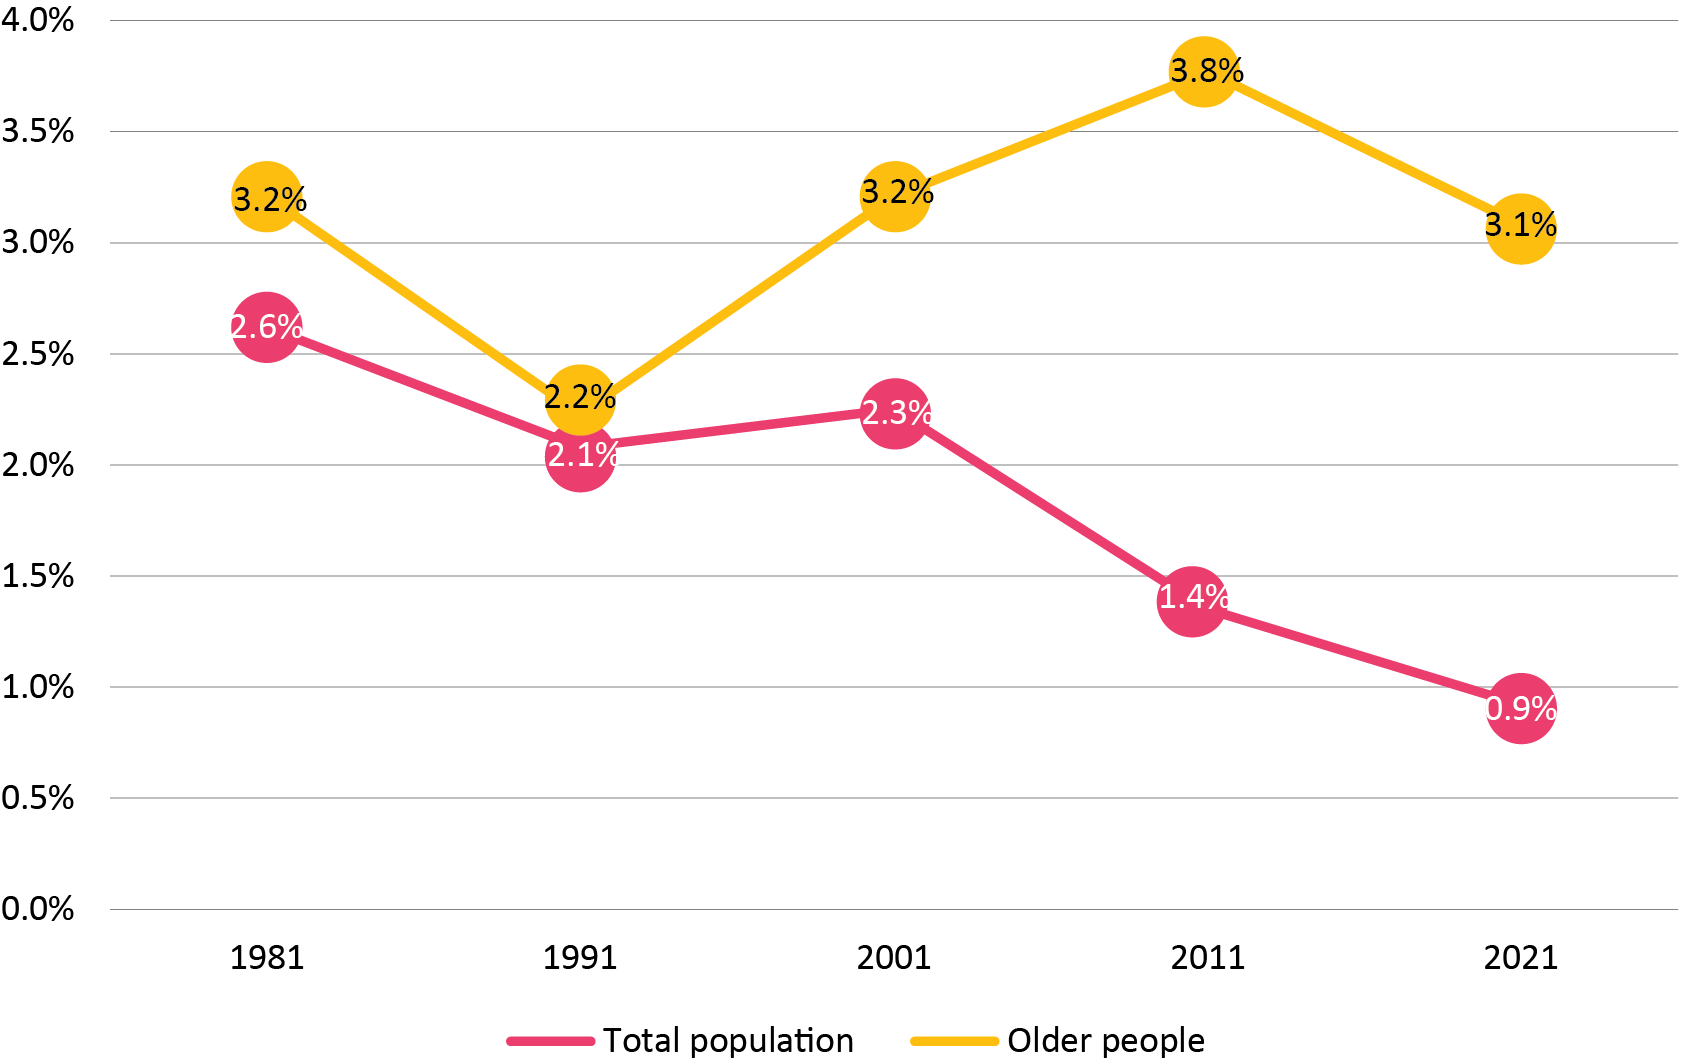
A comparison of the growth rate of the total population and the elderly shows the 2001 census to be a watershed because there has been a sharp decline in the growth rate of the total population thereafter (Figure 1). A factor to also consider in this regard is that in 2011 and 2021, 1.9 million and 2.2 million, respectively, were recorded as absentees outside the country.
Figure 1: Growth Rate of Older People and Total Population, 1881–2021
Age Structure Transition and Index of Ageing
The age distribution of the population can be broadly grouped into three categories. Those aged below 15 years are referred to as ‘young’, between 15 years and below 60 years as ‘mature’, and those aged 60 years and above as ‘older people’ or ‘the aged’. Table 3 shows that the share of the young in the total population decreased from 42.4 per cent to 27.8 per cent in a matter of three decades between 1991 and 2021. That is a significant change in the age structure of the population, indicating a very rapid change in total fertility rate and number of women having children. More importantly, the proportional decrease of the young in the latest intercensal decade, i.e., from 34.9 per cent to 27.8 per cent, was probably too fast a decline and warrants serious deliberations on the future of the country’s social demography and Nepali society in general. The 1991 census appeared to herald a clear divide in the changing shares of the young and mature populations whereafter the proportion of the aged has shown a persistent increase.
Table 3: Population Distribution by Broad Age Groups and Index of Ageing
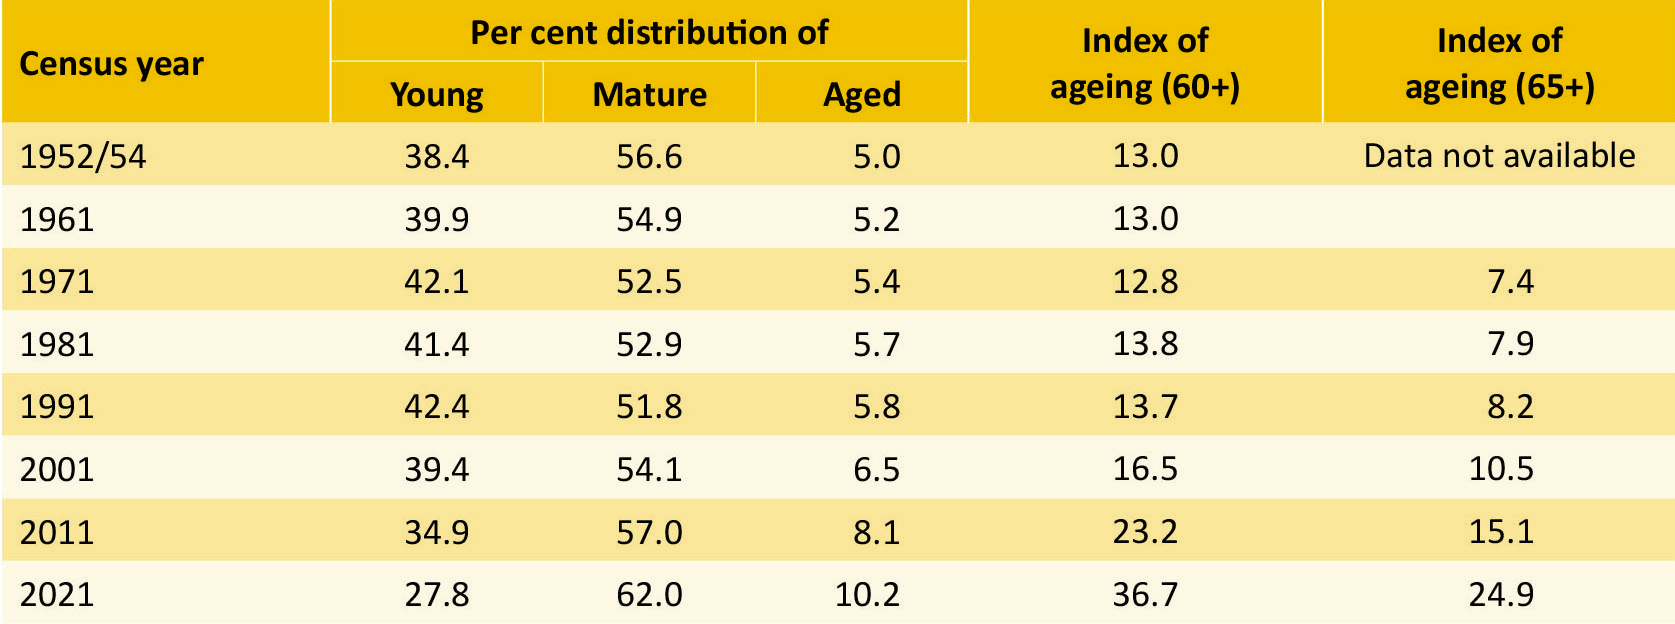
The index of ageing refers to the number of older people aged 60 years of age and over (which in developed countries is 65 years and above) per hundred young people below 15 years of age. A higher value of the index refers to the presence of a large number of aged people. The index was 13 (i.e., 13 older people per 100 young people) in 1952/54 and remained almost constant until 1991. Censuses since 2001 have shown sharp increases in the index value, reaching 36.7 in 2021. The pace of consistent increase in the index in the last three census periods clearly shows the prominence of older people in the total population in Nepal.
For international comparison, the index has also been calculated using individuals aged 65 and above. While the resulting index values are lower, they clearly demonstrate a consistent increase in the proportion of older people over the last five censuses. More importantly, despite the smaller values of the index of ageing, intercensal change in the index is higher (64.9%) for those aged 65 and above than for those aged 60 and above (58.2%).
Changing Age Composition and Dependency Ratios
Though Nepal is yet to be recognised as a developing country, the signs of demographic maturity are already evident. Figure 2 shows the trend in three important indicators of the population, namely, older people aged 60 years of age and over, the proportion of the young (i.e., below 15 years of age), and the dependency ratio of the population. Changes in these indicators over time demonstrate a clear greying trend of Nepal’s population. Between 1952/54 and 2021, the total population increased 3.5-fold while the population of the elderly increased by 7.2 times.
Figure 2: Changing Proportion of Older People, the Young And Dependency Ratios 1952/54 – 2021
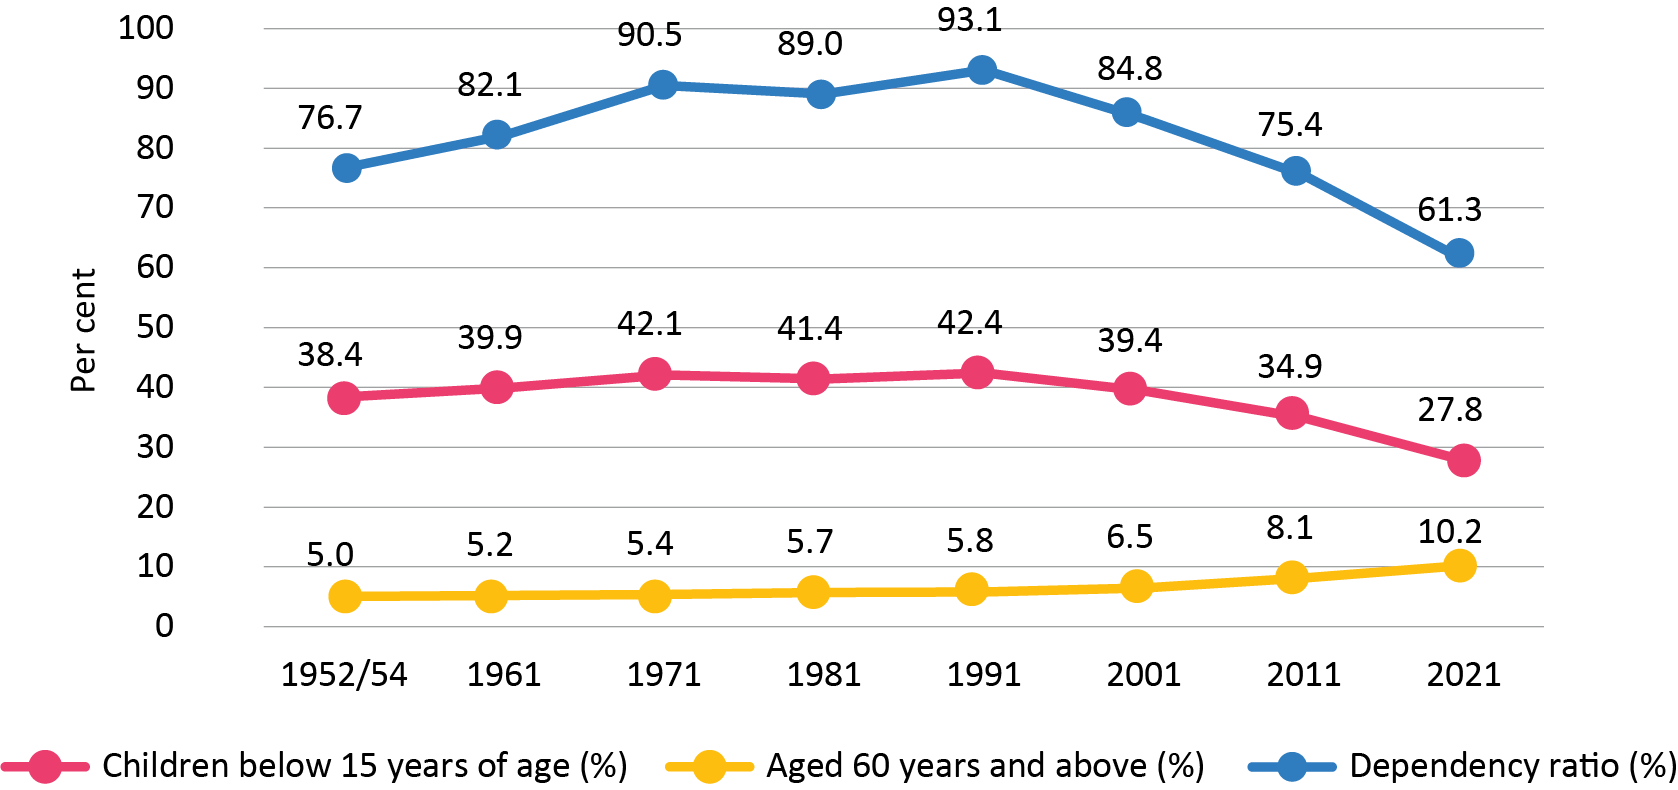
The dependency ratio, which reflects the burden of dependency on the productive population, presents an overall positive picture over time. The ratio was the highest in 1991 and decreased to an all-time low in 2021. While the decrease was primarily due to the decrease in child dependency, dependency of the aged has been on the rise continuously. Between 1991 and 2021, the old-age dependency ratio increased by more than 47 per cent (from 11.2% to 16.5%). As longevity increases the aged dependency continues to rise.
The differential level of burden is such that children graduate from being dependants to being part of the productive population but the aged remain in the same category as long as they live. The decline in dependency ratio is also an indicator of the fact that there are more of the working-age population at present than ever before, resulting in a ‘demographic dividend’, which will not last long because the population entering the labour force will decline over time.
Longevity
The ageing trends and patterns also need to be examined from the perspective of life expectancy at birth and changes in that provide a picture of the health and mortality situation of the population. In general, with an increase in life expectancy, the proportion of people alive in the older age cohorts increases. Nepal is no exception. Figure 3 shows the trends in life expectancy at birth based on the last five censuses.
Figure 3: Trends in Life Expectancy at Birth 1981 -2021
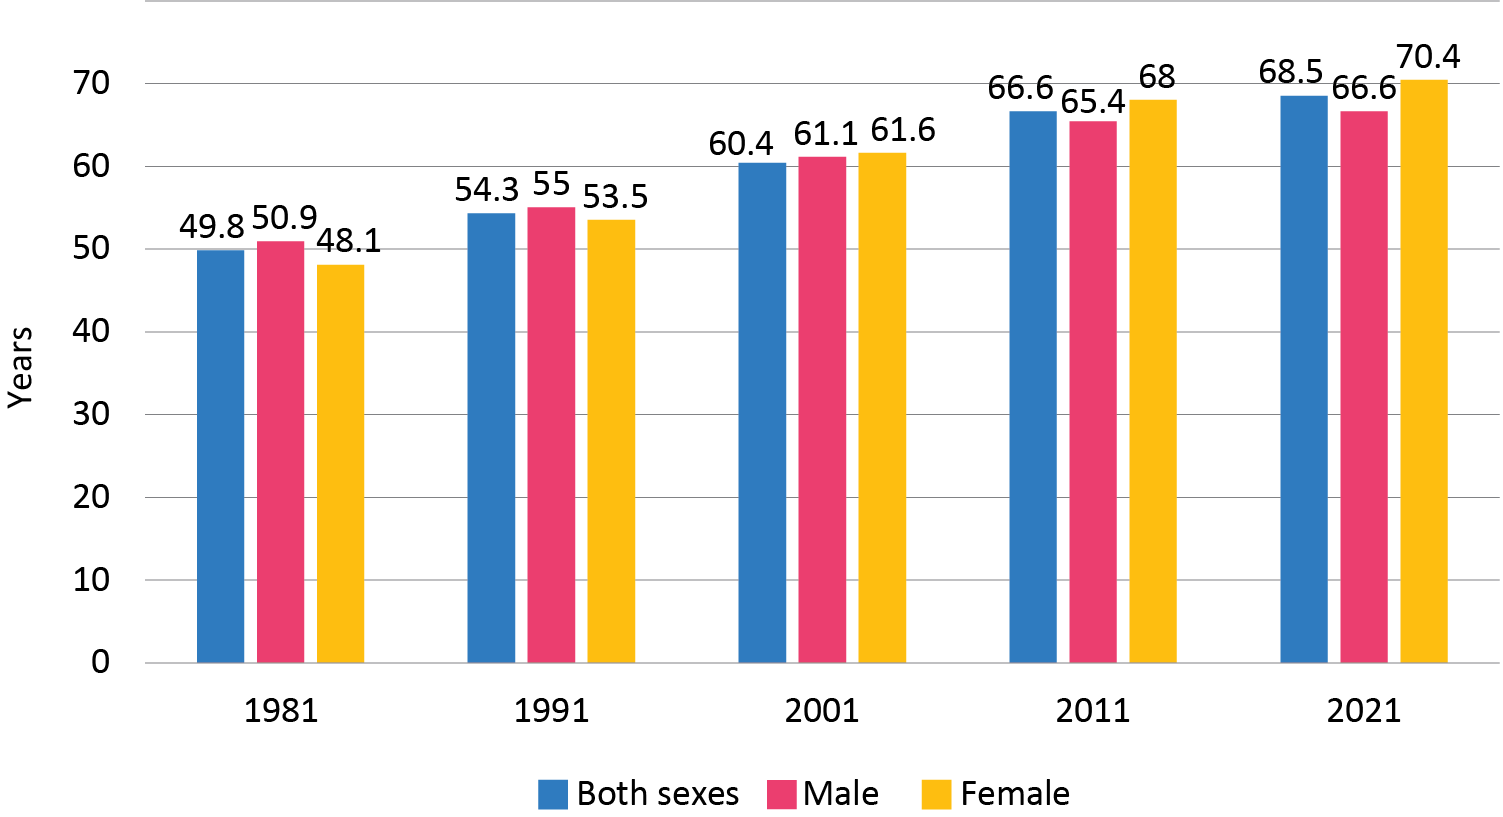
It was 50 years for both sexes in 1981, reaching 54 years in 1991. Both the censuses showed higher life expectancy for males than for females. Census 2001 showed an increase in life expectancy by six years, reaching 60.4 years, a significant increase in a decade. Also, for the first time in the census history of Nepal it showed female life expectancy higher than that of males. Life expectancy continued to increase in the same pattern in the succeeding years. Census 2011 showed an addition of 6.2 year in the total life expectancy and onwards the pace of increase slowed down relatively. By the 2021 census, the average life expectancy for both sexes had reached 68.5 years while the difference between male and female life expectancy was 3.8 years with female life expectancy of 70.4 years and that of males, 66.6 years.
Household Size and Old-age Dependency ratio
Figure 4 shows the changing average household sizes as reflected in the successive censuses since 1981. The average household size in Nepal was 5.8 persons in 1981. By 2021, it had come down to 4.4 persons, showing a decrease of 1.4 persons per household. Meanwhile, the longevity of Nepalis had increased significantly, adding almost 19 years. The increase in life expectancy and decrease in household size reflects a trend of family nucleation in Nepali society. If that were not the case, with more members of the family surviving to older ages, the family size would have increased.
Figure 4: Changing Household Size and Old Dependency Ratio 1981 -2021
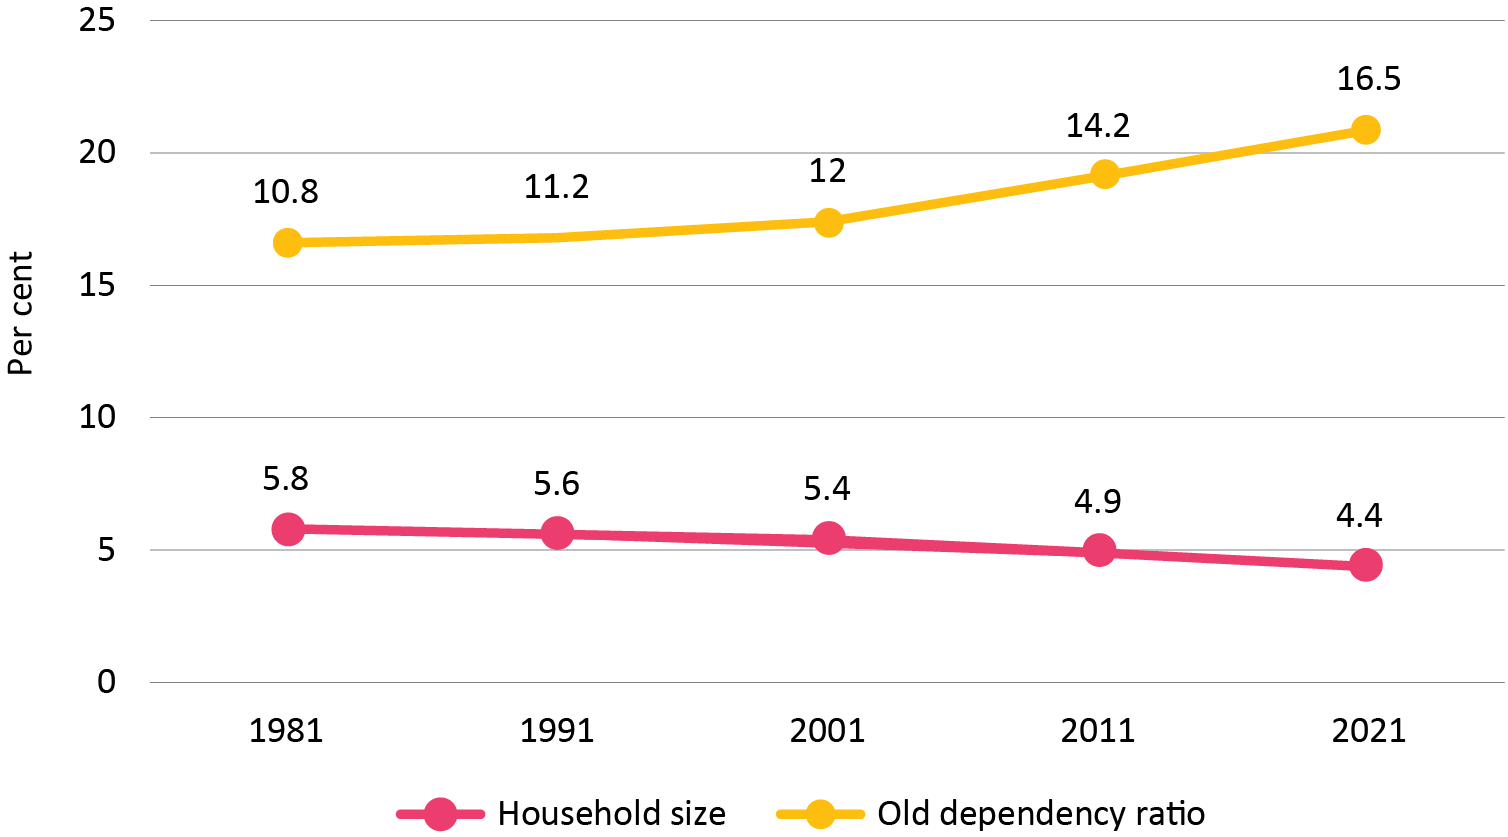
While there has been a gradual decline in the overall dependency ratio over the last four censuses, the old-age dependency ratio (ratio of individuals aged 60+ to every 100 people of working age) has been rising continuously since 1981, reaching 16.5 in 2021, an increase of 52.8 per cent. There is no direct relation between household size and old-age dependency ratio but a rapid increase in the dependency ratio has implications on family resources where the number of family members likely to support older people continues to decrease.
Migration and Older People
Census 2021 showed that 23.3 per cent of the households had one or more member away from home abroad. Likewise, another 13.3 per cent of the households had one or more absent member within the country.
Population ageing and migration abroad are closely related. According to the method of census enumeration, the population away from home for six or more months are not counted in their place of origin. In the case of internal migrants, since they are counted in the current place of residence, they are included in the resident population of the country. But those away from home and abroad for six months or more are out of the purview of the usually residing population of the country. One of the few established facts of migration is that most migrants are young adults. This means that this absenteeism largely affects the arithmetic of percentage of older people in the given geographical unit.
A total of 4,457,828 people were absent from home at the time of census-taking in November 2021 (Table 4). The internal:external migration ratio was 1.03. This means the number of internal migrants and external migrants was almost equal, with internal migrants having a minimal edge. The national average ratio of migration to total resident population was 15.3. By urban–rural residence, this ratio was higher in rural areas than in the urban, showing a larger proportion of migrants from the former. By geographical region, the migration ratio was high in the Mountains and followed closely by the Hills with the ratio the lowest in the Tarai.
Table 4: Absent Population, Absent Ratio and Per Cent of Older People, 2021
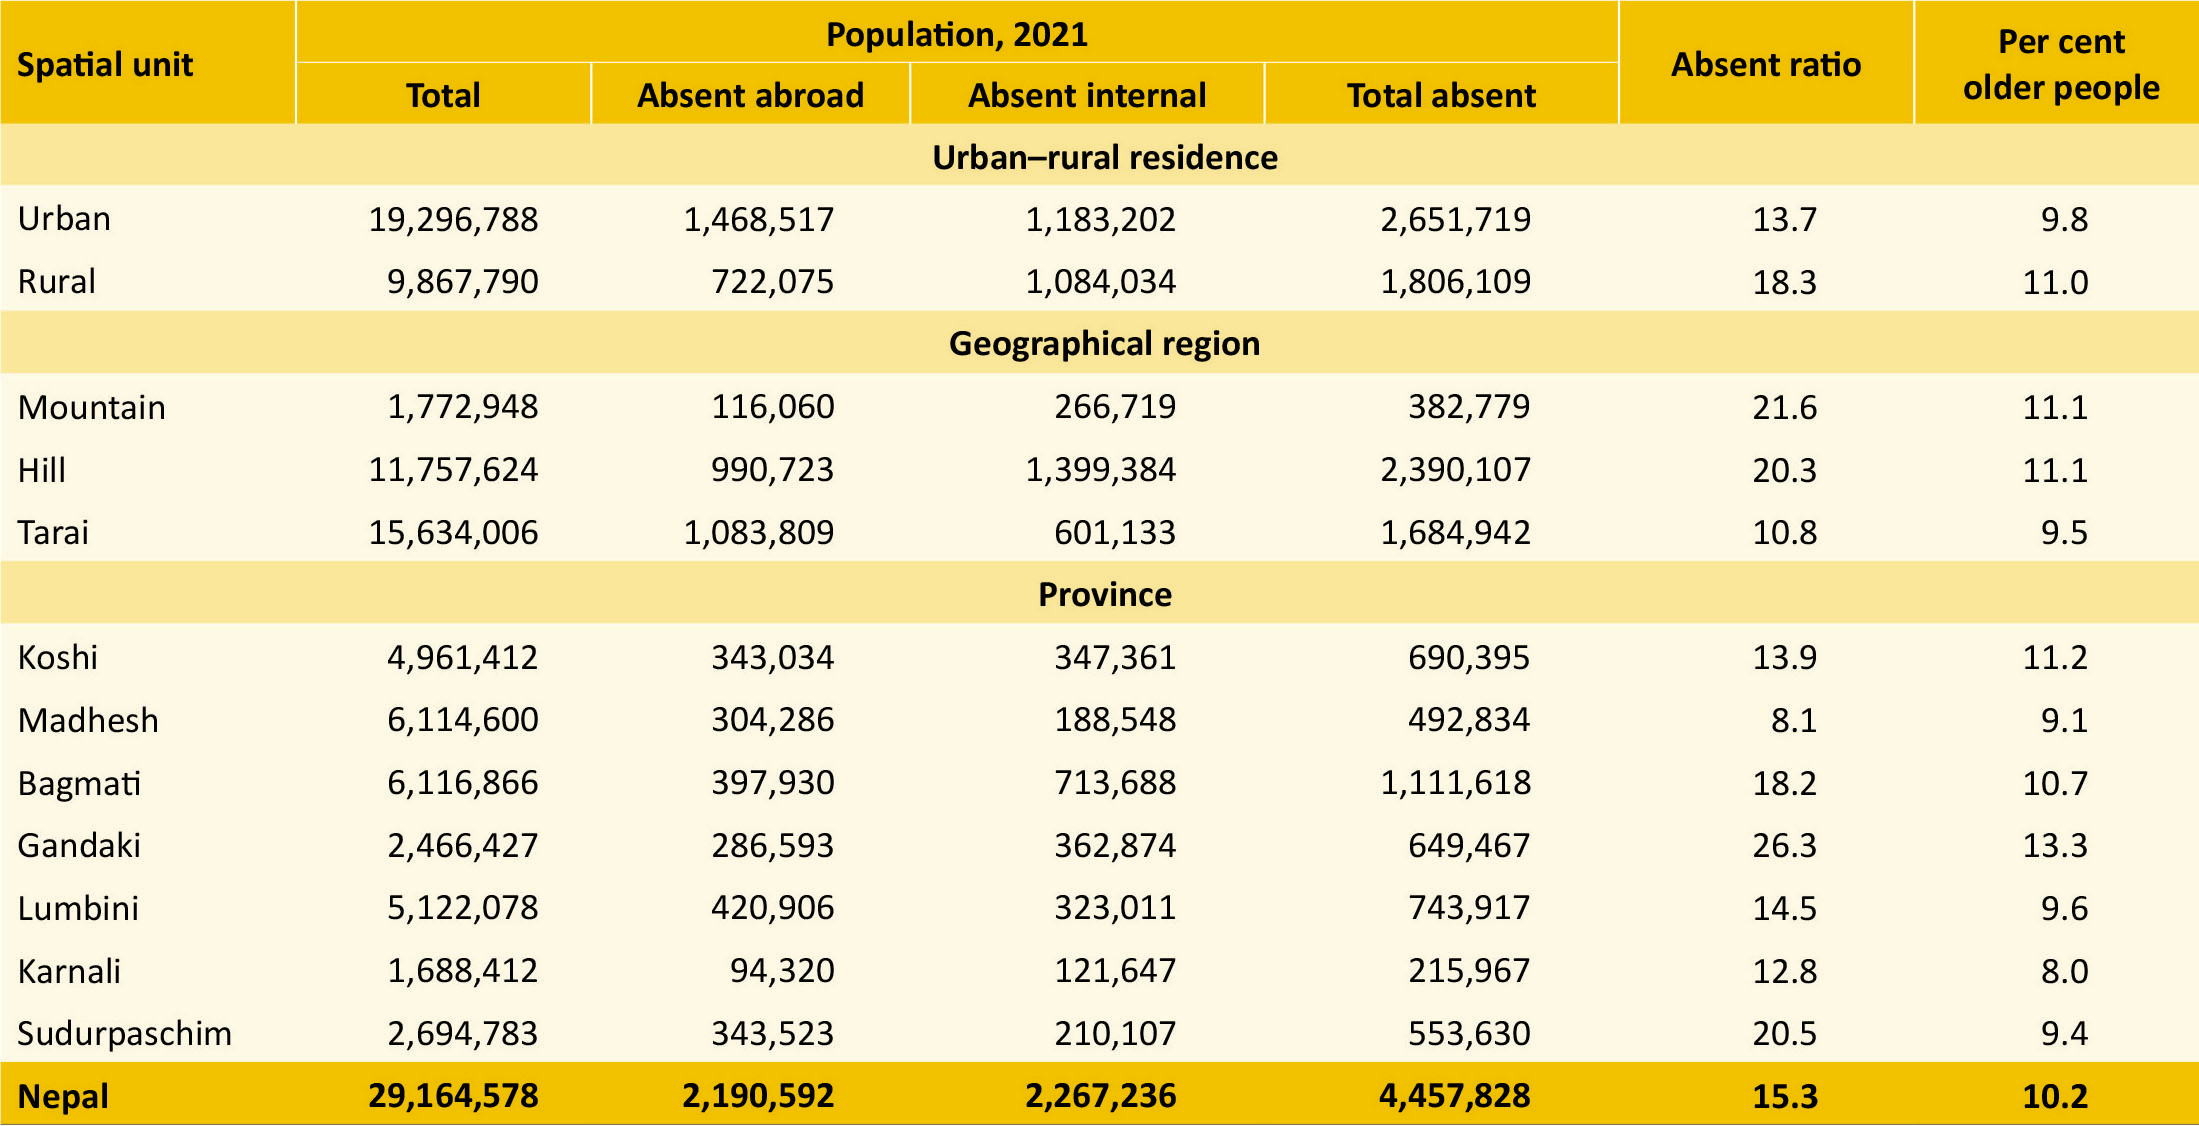
The provincial scenario showed a sharp difference in absent ratio. It was the highest in Gandaki (26.3%) and the lowest in Madhesh (8.1%). Koshi, Madhesh, Lumbini, and Karnali had ratios less than the national average.
The spatial data above indicates a high correlation between migration and population ageing. More important is the impact of migration of family members on elderly care for which detailed studies are warranted. The absence of able-bodied family members and the relocation of the absent member’s spouse and children to urban areas, leaving the older parent(s) in the village, reflects what may be called an ‘empty-nest syndrome’ in the village. This is not a welcome situation for older people.
Conclusion
While Nepal lacks comprehensive studies on the living conditions and contributions of older people to their families and communities, it is fair to say that the living conditions of a significant proportion of the elderly are unsatisfactory, and their contributions are often underestimated. Over the decades, the state has introduced some social support provisions and legal frameworks. However, the primary responsibility for creating a supportive living environment and ensuring social security often falls on families and the elderly themselves.
Challenges such as increasing absenteeism among economically active household members, declining agricultural production due to land abandonment, and crop damage from wildlife are particularly tough on older individuals in rural areas, who value traditional agrarian livelihoods. Although remittances can help sustain livelihoods, they may also encourage individualism, in a shift away from the communal support that older people traditionally relied on.
As it is a global trend, Nepal can expect a continuous rise in both the number and proportion of older people. The increase in old-age dependency alongside a decrease in child dependency, combined with rising absenteeism, means that many older individuals will require substantial support in terms of livelihoods, healthcare, and emotional wellbeing in the years ahead. Nepal faces a financial dilemma: while it must prioritise quality education and skill development for younger generations to remain competitive in the global market, it also has to invest in the support of older citizens.

